Muscle music
A science day outreach project, teaching about neuroscience by making your muscles a musical instrument.
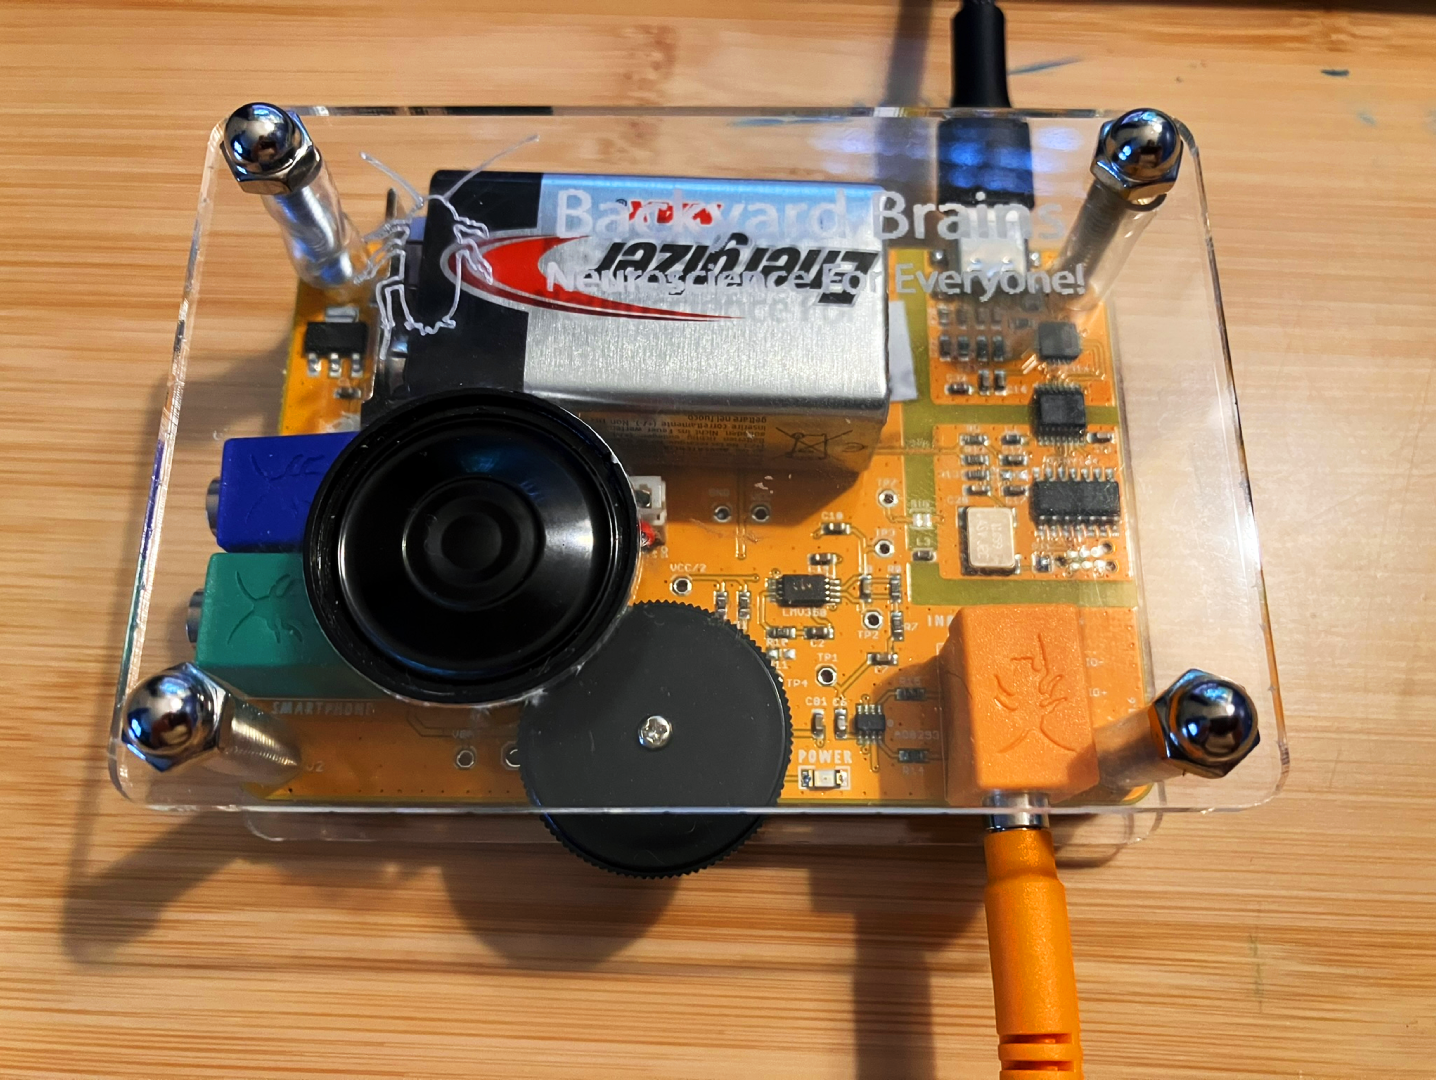
This is a long term collaborative project with Petra Bachanová. It is a Python program that builds on the Neuron SpikerBox device developed by Backyard Brains. You can try it yourself with some previously recorded muscle signals - check out the GitHub repository!
The idea here is to build on the SpikerBox, creating a program that helps us to explain to kids (and to many curious parents) how our brains communicate with our muscles.
We’ve used the project at the 2024 and ‘25 Dartmouth Science Days, and we plan to improve it for next year’s, too. While a “long term” project in that sense, it’s development has been highly concentrated in the takeaway-fuelled hours leading up to each Science Day, plus a little after while things were fresh in our minds.
On both occasions, those hours began with feelings of excitement and ambition, “what if we did this to it?”, and have ended with feelings of exhaustion and mild stress; “… perhaps we should undo this to it? And it might work tomorrow?”. (Both years were a success, in the end!).
About Electromyography (EMG) signals and the SpikerBox
Before diving into how we make muscles sing, brief introductions to EMG signals the SpikerBox are in order.
When contracting a muscle, an upper motor neuron (originating in the brain) sends an electrical signal along the neuron, until it meets its target lower motor neuron in the spinal chord. This lower neuron transmits an electrical signal along to its synapses, which interface with muscle fibres. EMG does not directly measure this neuron’s electrical signal, but rather the action potential (rapid voltage changes across a cell’s membrane) of the muscle fibre’s response to this signal.
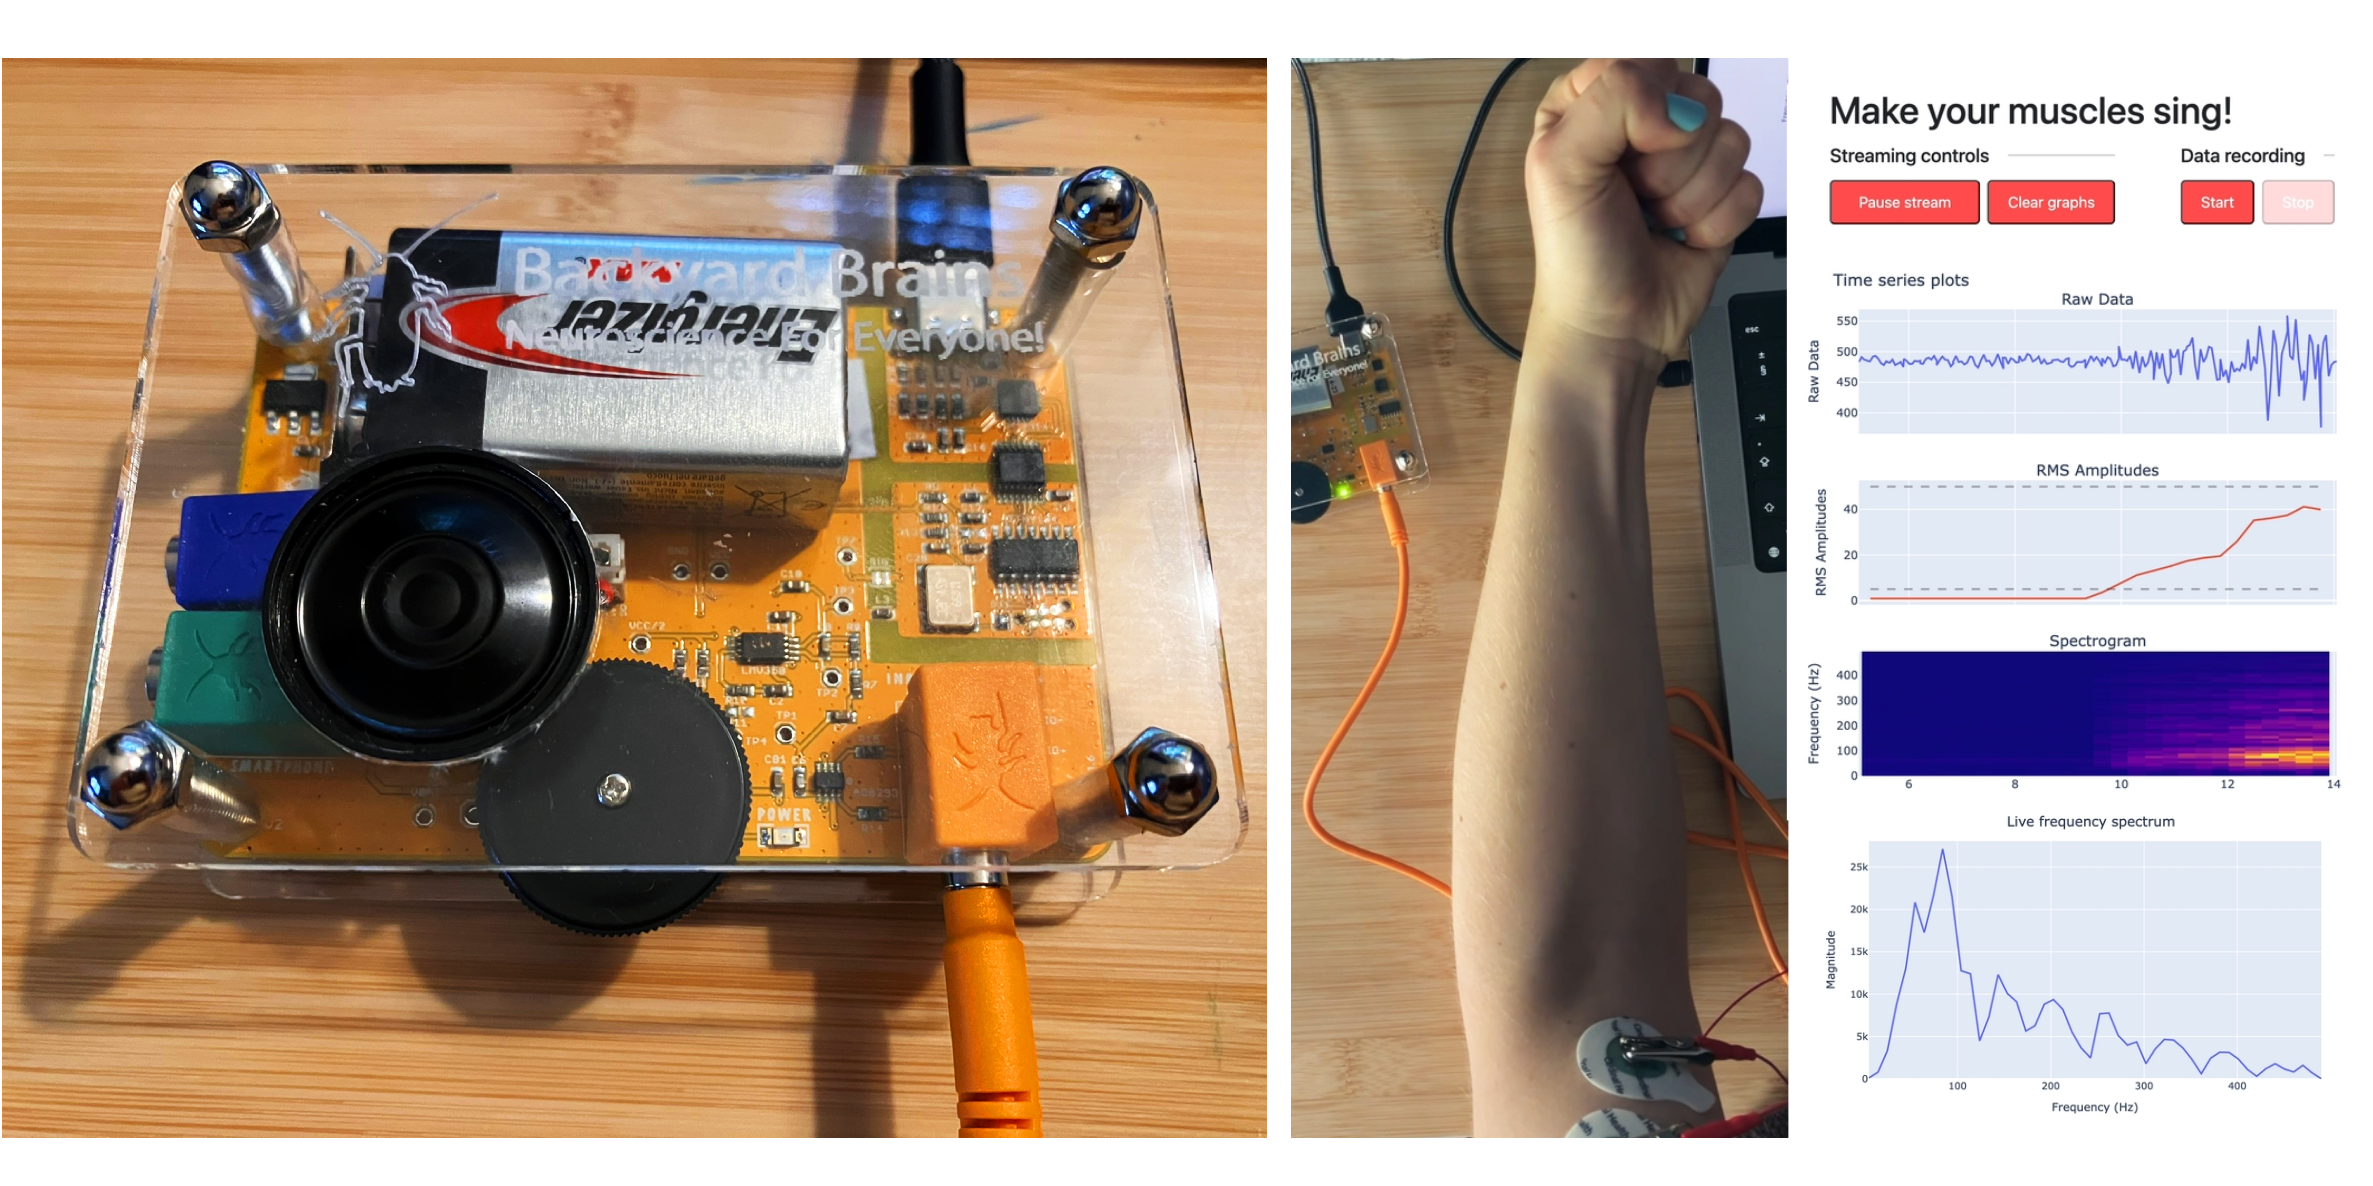
From electrodes placed on the skin, the SpikerBox filters and amplifies the fibres’ signals, before serially encoding the data for USB transmission - which is what we use in our Python code.
Our code
This is a rough sketch of the setup. The backend loops over steps 1-5, until the user sends a frontend command to pause or stop the program.
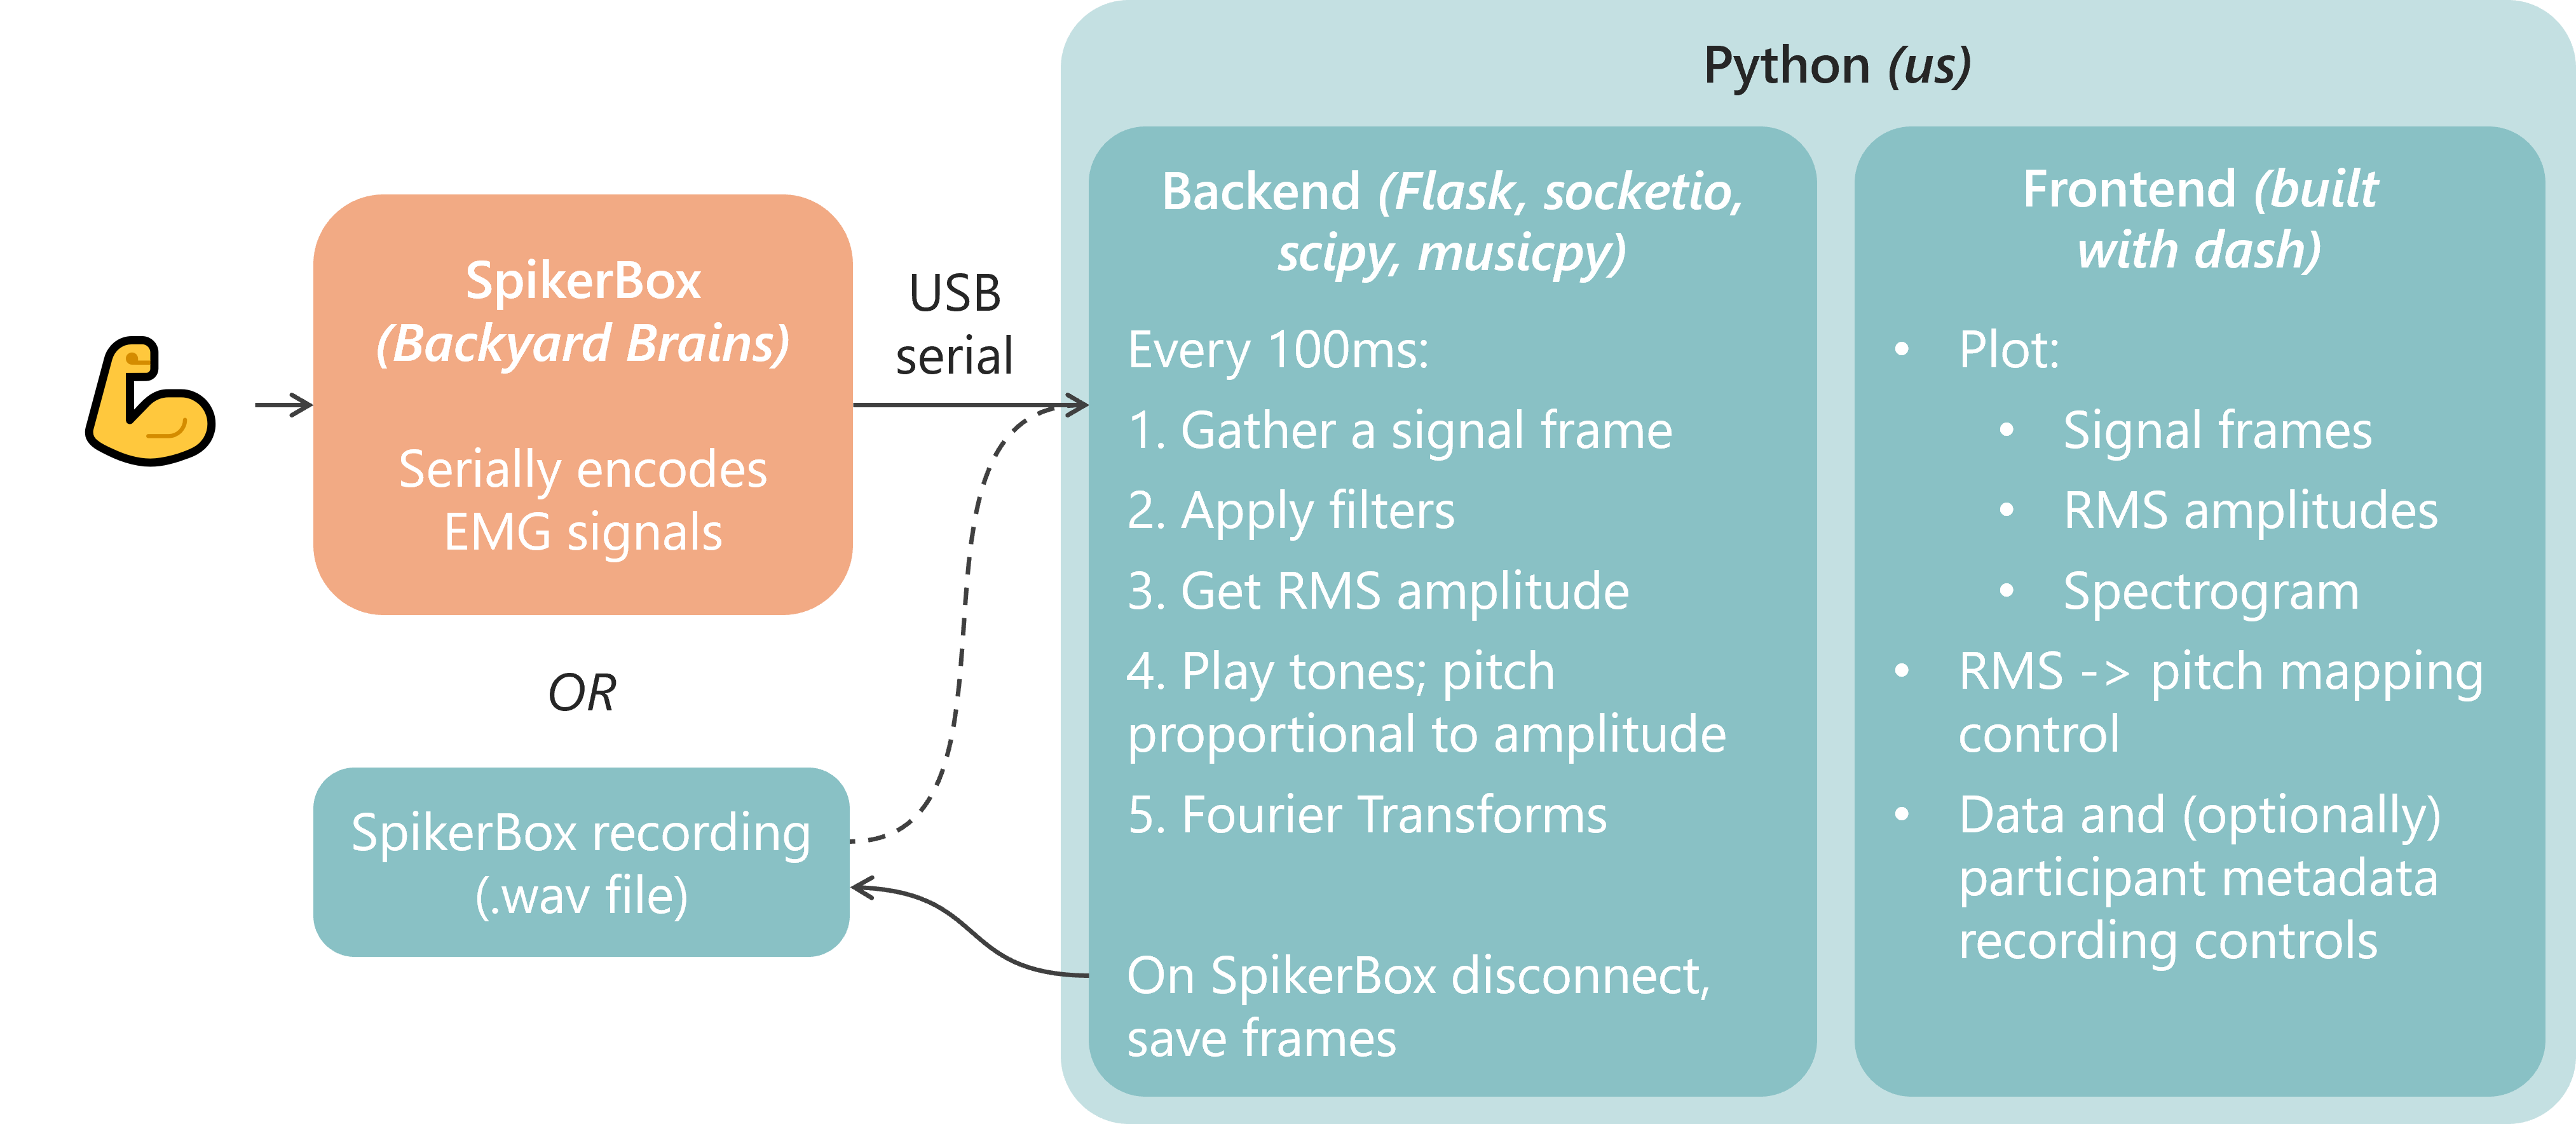
Backend processing steps, and frontend plots
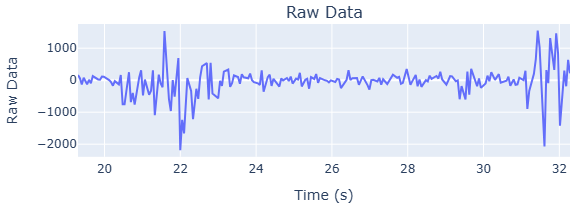
1: Reading and ‘chunking’the data
Two data reading modes are available:
- Read real-time SpikerBox data over USB serial
- Read recorded SpikerBox data from file
Either way, the first step is to read a window of data. We’ve been using windows of length 200ms - at the SpikerBox’s 10kHz sampling rate, this corresponds to 2000 data points.
Incorporating b. has been been very useful during development. Besides not needing the SpikerBox to hand, it also offers the opportunity for others to easily test the tool.
Beyond this point, the code is agnostic as to whether the data is coming from the SpikerBox or from recorded data - aside from a few places in the front end.
2: Filtering
The following is a nice illustration of EMG signal frequencies and common noise contribution sources and frequencies, taken from Reducing Noise, Artifacts and Interference in Single-Channel EMG Signals: A Review.
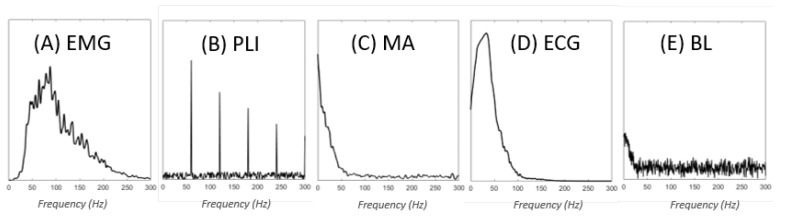
For B, we apply a notch filter at the electricity grid frequency (50 or 60Hz) and its harmonics. The noise contribution from the grid is extremely noticable - to the point where without the filter, we’ve noticed that the SpikerBox signal becomes a garbled mess, if the laptop is charging from mains.
C (MA) refers to ‘motion artifacts’. These can relate to body movement during recording (usually in the 0-20Hz range), cable movement (up to 50Hz), and electrode movement on, or lifting from, the skin. For these, and any higher frequency noise beoynd the expected EMG range, a band pass filter is applied - currently set to filter anything outside of 20Hz - 450Hz.
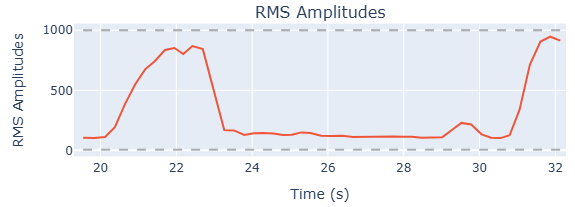
D (ECG) refers to electrical signals from the heart - it would be interesting to see whether we can see this in our data recordings as periodic ‘bumps’ in the data, and account for its noise contribution. I recall seeing a periodic bump in the RMS amplitudes in one participant this year, when the bicep was at rest - and I wondered whether this coming from the heart’s electrical activity.
3 - 4: Get RMS amplitude and play a tone
We use the RMS amplitude as a measure of how hard the muscle is flexing, and thus the pitch of note played. The amplitude is mapped to a note range from C4 (Middle C) to C6 (Middle C plus two octaves). We have a minimum cut-off value, below which no notes are played.
The volume and duration of each note is currently constant (the same as the signal window duration, e.g. 0.2s). The ability to control the note duration would add an interesting dimension to the ‘instrument’, but we’ve yet to test ways to achieve this.
Back to the pitch control - each participant’s muscles are different. Baseline noise levels, and the strength of EMG signals, are individual. You could imagine that a more developed muscle responds more strongly to a neuron’s signal, and contracts more fibres, leading to a stronger EMG signal. Moreover, each environment is different - think the electrical noise from mains or digital watches.
For these reasons the mapping between RMS amplitudes and note pitch is tuned for each participant. This can can be controlled through the frontend.
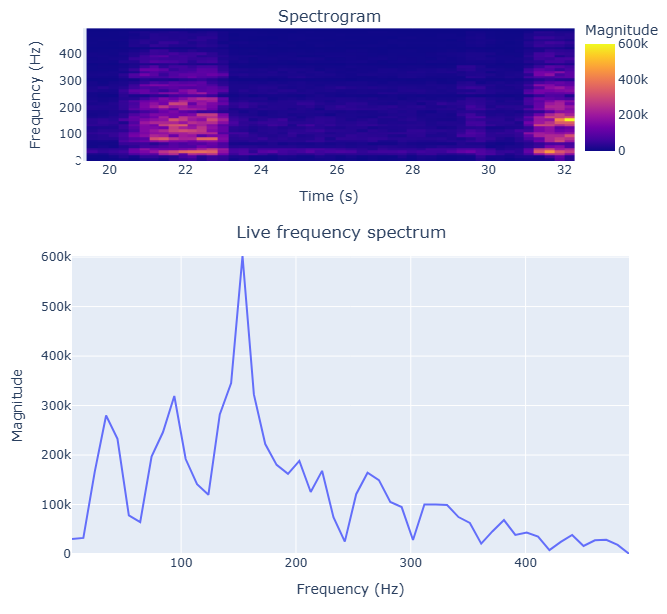
5: Get signal frequencies
The signal’s frequency content currently has no bearing on the music that is played; we measure it mainly to fulfil some scientific curiosity. Seeing the signal’s frequency content is interesting in itself, however it does also serve a purpose. It can help us to diagnose the problem, when the program isn’t working well for a participant. If we can see a lot of noise from some frequency ranges, we can quickly filter those out by modifying our filters.
We find the frequencies by doing a Short-Time Fourier Transform (STFT), with a hop length equal to our signal’s window (= 2000 samples, at an update rate of 200ms and sample rate of 10kHz), and a frame length of twice that. See here for a good explainer on STFT.
In the project’s next iteration we may try to use the frequency content to control other elements of the music output, beyond the note’s pitch - e.g. volume, tone, the duration of a note - this will need some experimenting.
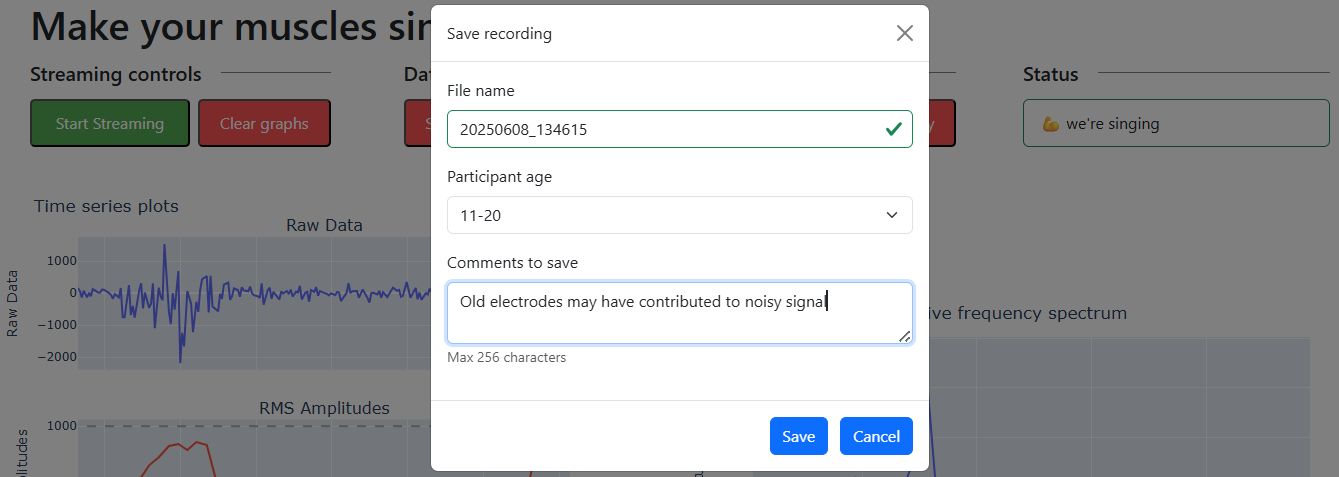
Data recording
For consenting partipicants, we record the input data into the program, along with some non-identifiable data such as age band, and any notes about the recording. The notes can be as simple as “worked well on this participant”, “noisy signal, maybe from digital watch”, or “old electrodes”.
This data should help us understand how to improve the recording process - e.g. by showing that we should replace the electrodes more frequently. Additionally, the program can read and process these recordings (just as it would process real-time data from the SpikerBox), which allows us to easily trial code changes.
Reception
Both science days were very succesful. After packing up at the end of one fun but long day, we reached the car park and overheard two families discussing the day. We saw the kids a few hours previously - and it was great to overhear them still talking excitedly about our stand and the experience of “playing” their muscles!
Many parents, particularly those who enjoy sports or going to the gym, have also enjoyed having a go.
This interactive way of gaining some understanding about what’s going on beneath our skin has, we think, been a success. However, it can be improved to help kids make the most of this learning opportunity and insipire more curiosity about neuroscience.
Future plans
Building on the opportunity to teach and inspire
While the project is certainly fun and stirs excitement, there is more we could do to get participant’s cogs turning on what is really going on between the brain and the muscles.
In past science days, our approach has been to explain upfront about the process of controlling the muscles, before allowing particpants to have go at it with making the music. Sometimes we would add interesting facts, or ask questions to test their understanding, while they played with the tool.
This is great for having a good time, but probably isn’t the most impactful approach to really teach and inspire about neuroscience.
Our stand this year was an improvement on the first, as we’d planned the station such that kids would speak with volunteers, following a ‘learning path’; learning about each component of our station bit by bit, until they reached the final part of the station (the SpikerBox and our program), and hopefully that learning all came together.
There are likely things we can do within the program itself to enhance the learning process, that we will consider for next year.
Improving music “controllability”
We have a small repository of SpikerBox data we’ve collected during demonstrations, along with participant metadata, which will allow us to test improvements to the program. Mainly, we would like to make the music more controllable; listening to something more tuneful would be very nice!
The notes themselves are one thing - perhaps an easy way to produce more tuneful music would be to limit the notes available to a subset of a scale.
The next aspect might be controlling the duration of each note - currently the duration can’t be controlled.
Achieving this would need some thought (that hasn’t had time to happen, yet…) and testing - but it’s difficult to imagine how we could control the note’s duration independently of the pitch, without just adding electrodes to another muscle. To be updated before the next science day!