Off-grid data centre app
You can view the app here.
What it does
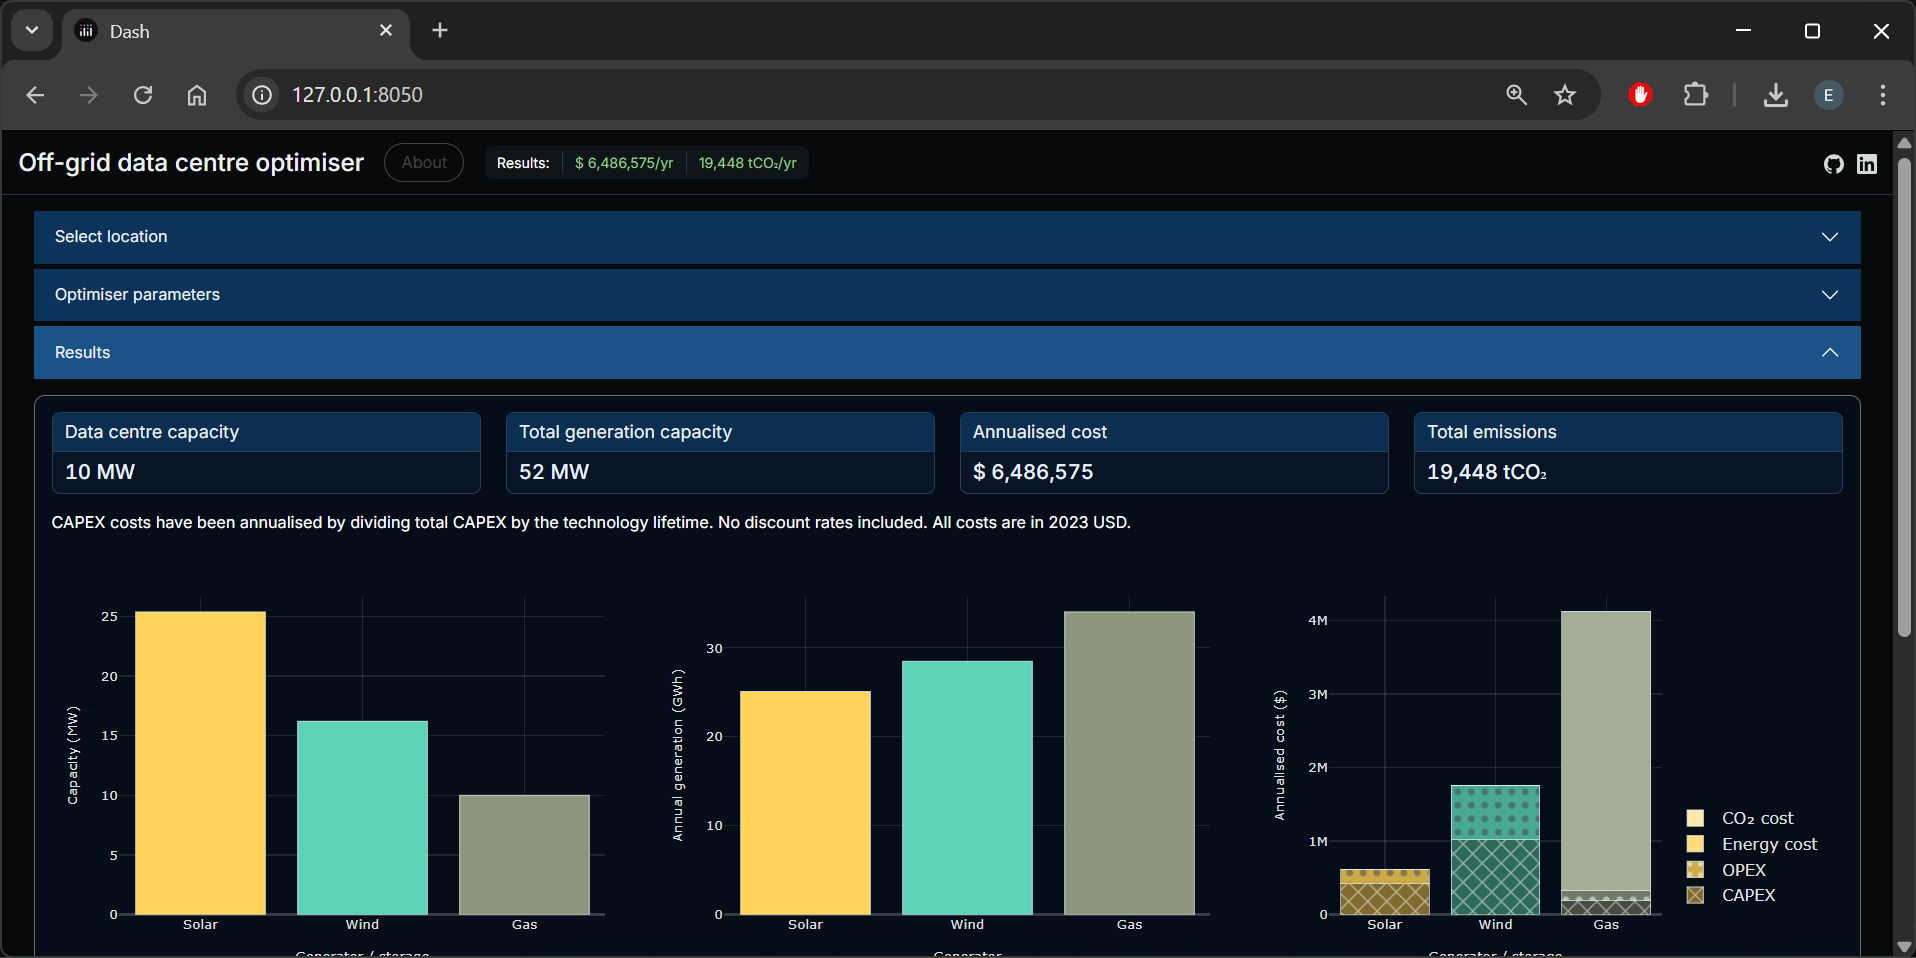
This app aims to demonstrate the most cost-effective power sources for an off-grid data centre.
I built it in part to build on some technical knowledge, and in part as something fun to develop while outdoor hobbies were hampered by a broken rib and a spell of particularly British weather.
How it works
The core of the app itself is PyPSA, a Python package for optimising energy systems. The PyPSA module is configured to dynamically build the generator and storage options, with some cost assumptions provided by the user. It then solves for the least-cost system on an annualised cost basis.
The wind and Solar PV profiles are built from ERA5 weather data, for the cell selected on the Plotly map. ERA5 provides hourly solar radiation data, and wind speed (at 100m) data, at a spatial resolution of 0.25° lat and long.
-
Solar PV profiles are built by feeding the ERA5 data to the pvlib module. In generating the profiles, the pvlib module accounts for inverter clipping (the app assumes a DC:AC ratio of 1.25) and temperature-related losses.
-
Wind profiles are built first by extrapolating the ERA5 wind speed data to a higher altitude (for representative onshore / offshore hub heights), and secondly by applying a wind turine power curve to the hub height wind speed. Wind speed is extrapolated from the ERA5 altitude using the wind profile power law. Currently a single typical onshore turbine power curve is applied regardless of whether an onshore or offshore cell is selected.
This data, along with the selected cost parameters and other assumptions (most of which are listed in the UI) are fed to the PyPSA module to be optimised.
Architecture
I gained my AWS Solutions Architect Associate certification earlier this year, so I was keen to build on that knowledge during this project.
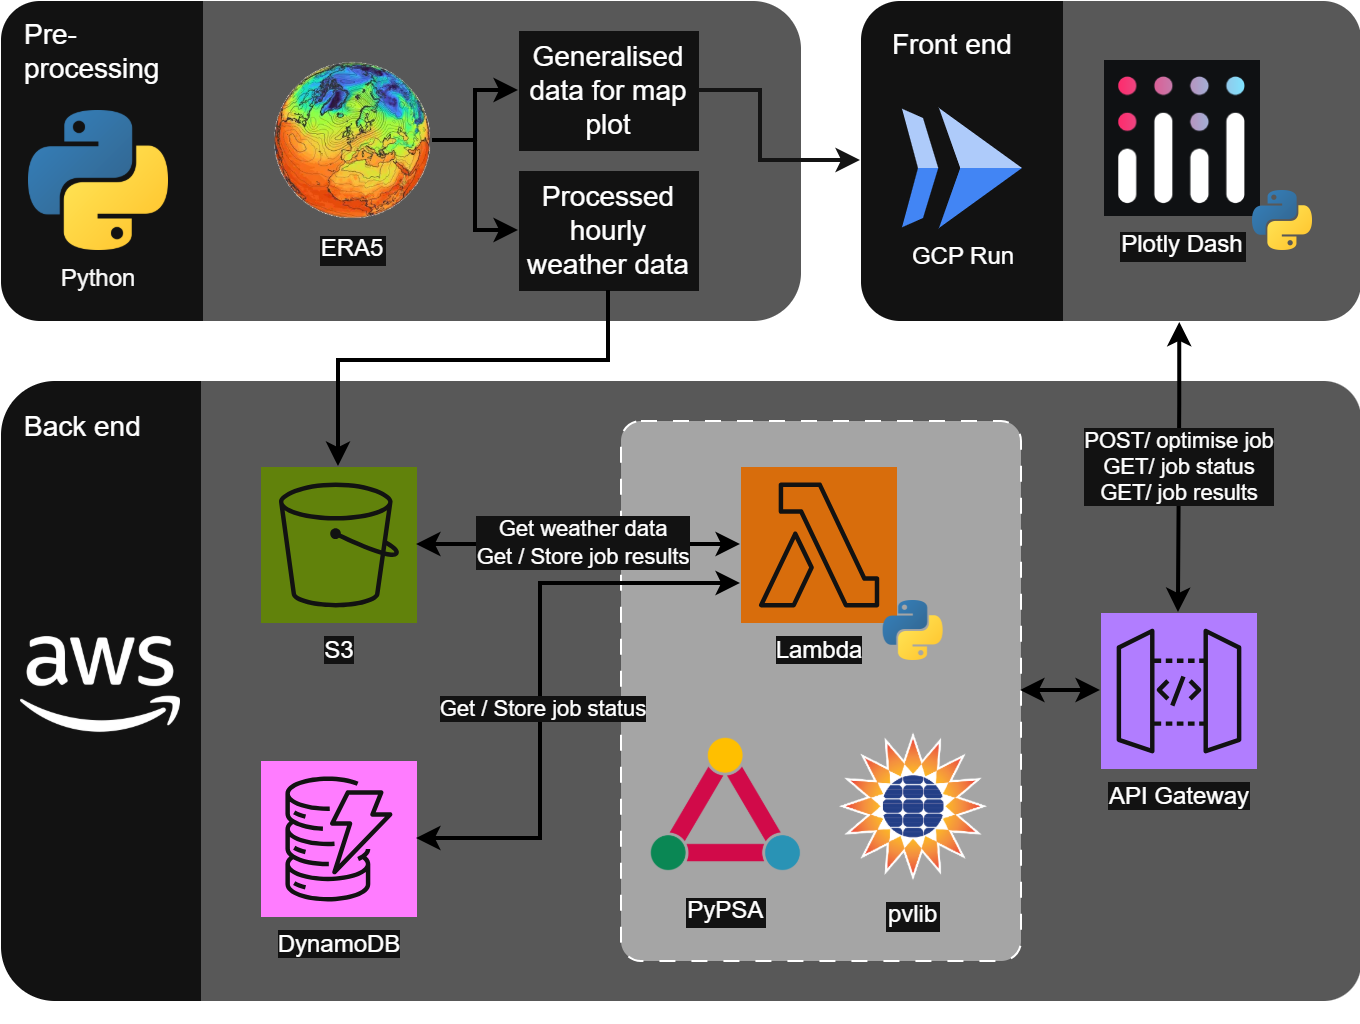
As the optimisation module does some heavy lifting, this is separated from the web server. The module runs in an AWS Lambda, triggered via a REST API.
The DynamoDB element wasn’t strictly necessary, but is used to record a job’s progress (and provide progress feedback to the user - accessed with another REST API). I mainly wanted the extra practice of setting up DynamoDB here.
- Pre-processing: Python scripts pre-process the ERA5 data - which is pulled via an ERA5 API. Processed data is used for:
- Generating geojsons used in the front end (for the interactive map)
- Generating hourly weather profiles (parquet files) saved in AWS S3
- Front end: is built using Plotly Dash. This is then hosted in GCP Run
- Back end: (all defined in Terraform) The front end calls APIs (via AWS API Gateway and a Lambda), which runs the optimise jobs
- DynamoDB is also used to store job status, so the user gets periodic updates about how the job is going
Limitations and next steps
- Tidy up repos & make public
- Add an option for electricity from the grid?
- Use a “typical meteorological year” weather file - the current weather data (ERA5) uses 2025 weather. This was an unusually sunny year in the UK, which likely makes Solar PV come out a bit more favourable than it should
- I think the default SMR CAPEX assumptions are probably a bit on the low side, comparing the costs with recent established nuclear costs. The latest Sizewell C construction cost is ~£12k/kW
- Any other ideas or find an issue? Let me know - you can contact me through my LinkedIn